Overall Reports In The WP Job Portal!
Overall Reports
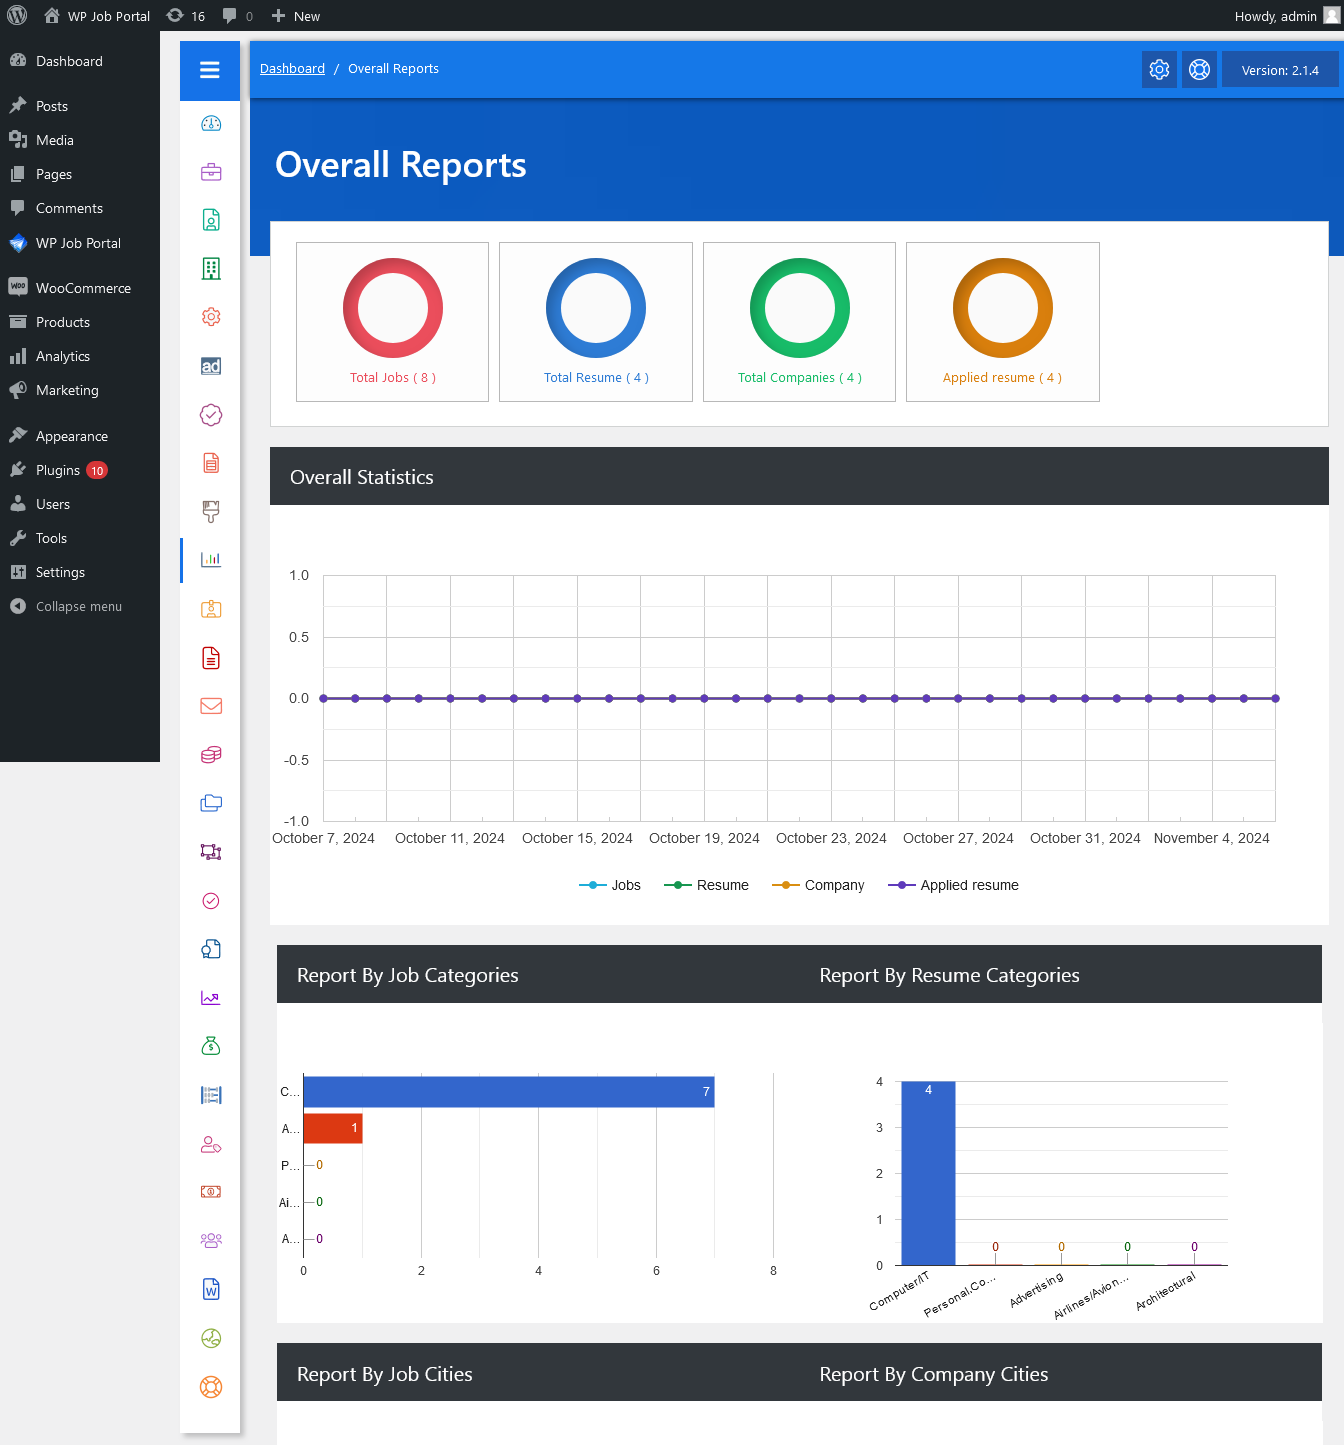
From your admin dashboard, navigate to Admin Dashboard → Dashboard Menu → Overall Reports. This page is the overall report for admin, it provides a general overview of different entities (job, resume, company). Graphs are used so that data can be represented in an easy-to-understand manner.
Overall Statistics
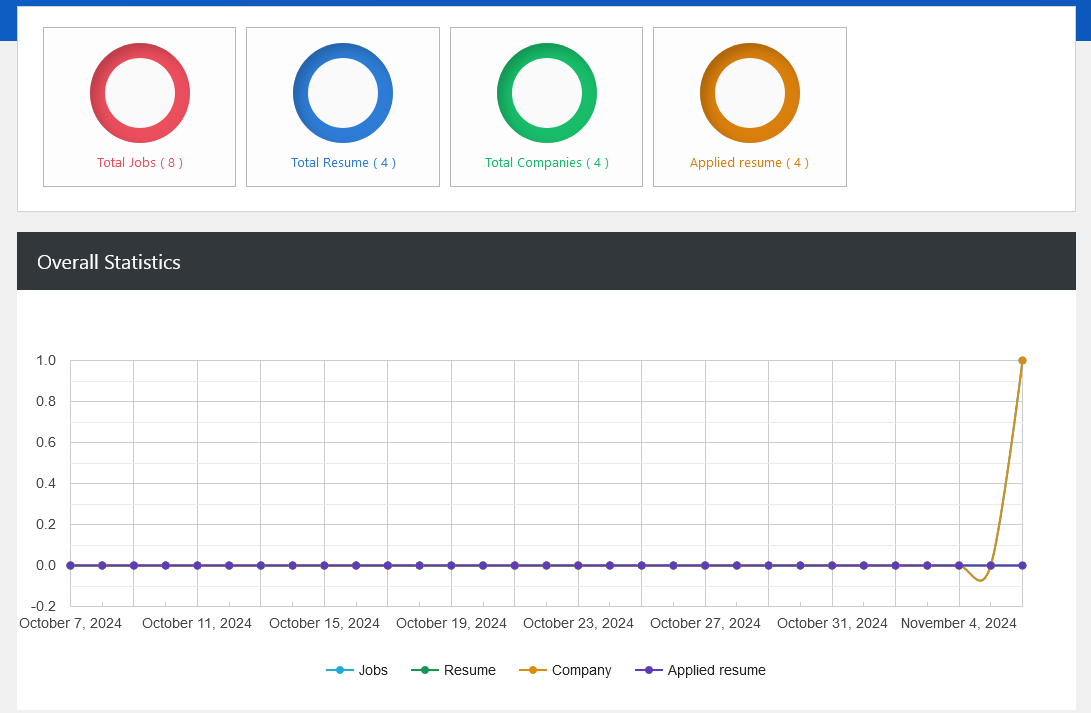
This portion has a graph that shows the number of companies, jobs, resumes, and job applications with weekly dates. Above the graph there or four boxes that hold the numbers of total jobs, total companies, total resumes, and total jobs applied.
Report By Job And Resume Categories
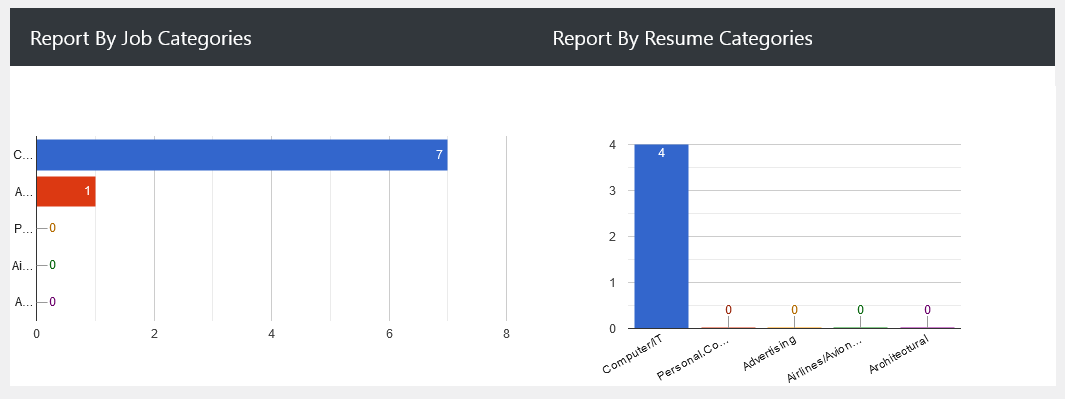
This portion has two different graphs that show the number of jobs and resumes by categories. Each portion of the chart represents a different category and the size of the portion represents the number of entities of that category.
Report By Job And Company Cities
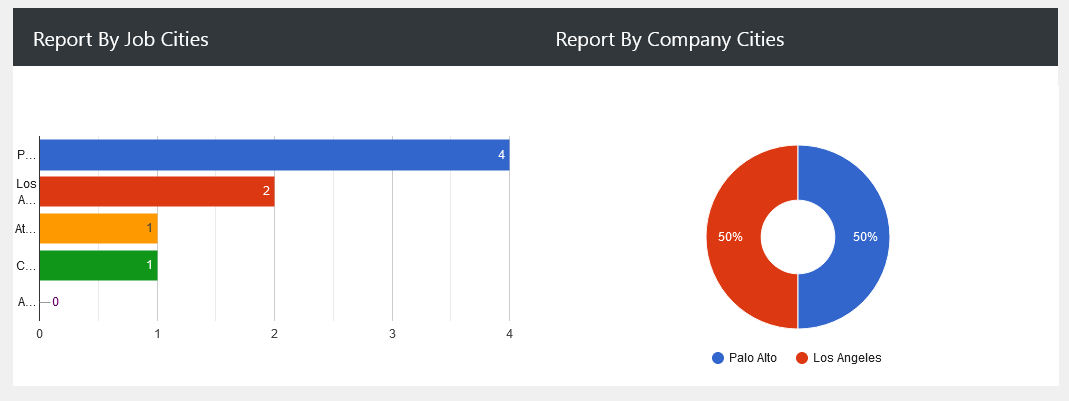
This portion has two different graphs that show the number of jobs, companies, and resumes by city. Each portion of the chart represents a different city and the size of the portion represents the number of entities of that city.
Report By Resume And Job Types
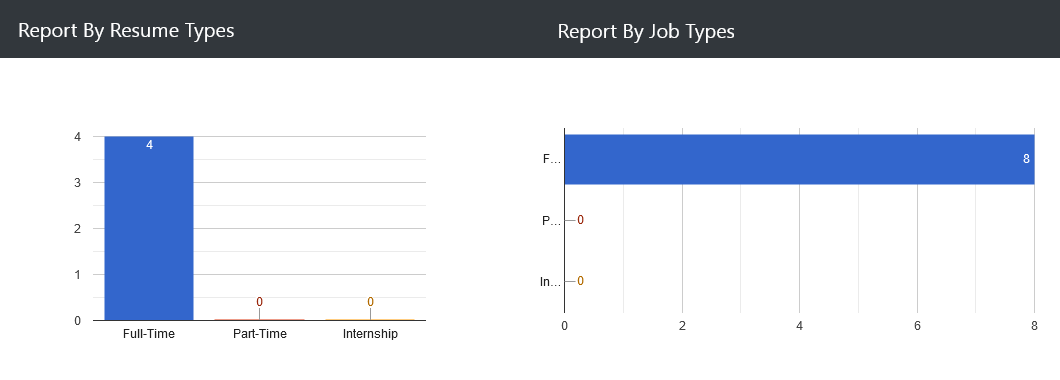
This portion has two different graphs that show the number of jobs and resumes by (job) types. Each portion of the chart represents a different (job) type and the size of the portion represents the number of entities of that (job) type.


